Since we're on a major migration process of this website, some component documents here are out of sync right now. In the meantime you may want to look at the early version of the new website
https://camel.apache.org/staging/
We would very much like to receive any feedback on the new site, please join the discussion on the Camel user mailing list.
Route Throttling ExampleAvailable as of Camel 2.1 AboutThis example shows how to use the new feature RoutePolicy to dynamically at runtime to throttle routes based on metrics gathered by the current number of inflight exchanges. What it means is that Camel will dynamic throttle the routes based on the flow of messages being processed at runtime. The example have 3 routes where as two of the routes are input routes, and the last is the processing route How it worksWhen the example runs we have a dependency from the routes as follows:
What the example demonstrates is that Camel is capable of dynamic throttling route1 and route2 based on the total flow of messages. At runtime Camel gathers the current inflight exchanges in a registry which is used for metrics. So when the flow is going too fast then the RoutePolicy kicks in and Camel provides the throttling policy in the How to runThe example has 3 maven goals to run the example
So at first you start the server. Then at any time you can run a client at will. For example you can run the JMS client and let it run to completion at the server. You can see at the server console logging that it reports the progress. And at sometime it will reach 10000 messages processed. You can then start the client again if you like. You can also start the other client to create the files which then let the example be a bit more complicated as we have concurrent processing of JMS messages and files at the same time. And where as both of these should be dynamic throttled so we wont go too fast. How to changeYou can check the file
<bean id="myPolicy" class="org.apache.camel.throttling.ThrottlingInflightRoutePolicy">
  <!-- define the scope to be context scoped so we measure against total inflight exchanges
       that means for both route1, route2 and route3 all together -->
  <property name="scope" value="Context"/>
  <!-- when we hit > 20 inflight exchanges then kick in and suspend the routes -->
  <property name="maxInflightExchanges" value="20"/>
  <!-- when we hit lower than 10% of the max = 2 then kick in and resume the routes
       the default percentage is 70% but in this demo we want a low value -->
  <property name="resumePercentOfMax" value="10"/>
  <!-- output throttling activity at WARN level -->
  <property name="loggingLevel" value="WARN"/>
</bean>
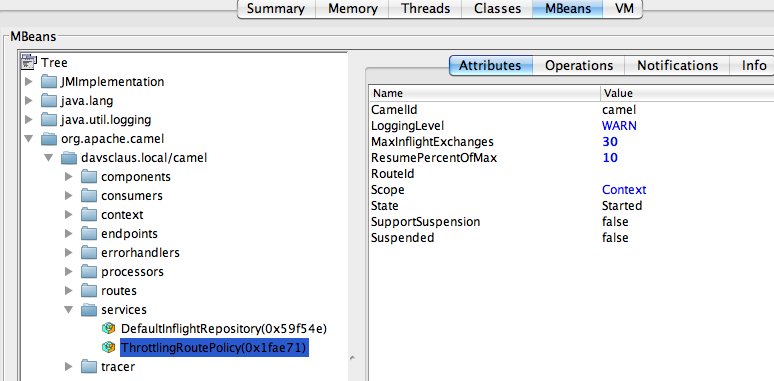
You can then change this and restart the server to see the changes in effect. JMX managementAt runtime you can manage the The screenshot below illustrates it from a JConsole. See more at using JMX with Camel. Sample output from running exampleWhen running the example you should see a lot of activity logged to the console. [ultMessageListenerContainer-42] +++JMS +++ INFO Received: 9800 messages so far. Last group took: 673 millis which is: 148.588 messages per second. average: 159.734 [currentConsumers=25&size=25000] ThrottlingInflightRoutePolicy WARN Throttling consumer: 25 > 20 inflight exchange by suspending consumer. [currentConsumers=25&size=25000] +++SEDA+++ INFO Received: 9800 messages so far. Last group took: 733 millis which is: 136.426 messages per second. average: 159.789 [currentConsumers=25&size=25000] ThrottlingInflightRoutePolicy WARN Throttling consumer: 2 <= 2 inflight exchange by resuming consumer. [currentConsumers=25&size=25000] ThrottlingInflightRoutePolicy WARN Throttling consumer: 25 > 20 inflight exchange by suspending consumer. [currentConsumers=25&size=25000] ThrottlingInflightRoutePolicy WARN Throttling consumer: 2 <= 2 inflight exchange by resuming consumer. [currentConsumers=25&size=25000] ThrottlingInflightRoutePolicy WARN Throttling consumer: 25 > 20 inflight exchange by suspending consumer. [currentConsumers=25&size=25000] ThrottlingInflightRoutePolicy WARN Throttling consumer: 2 <= 2 inflight exchange by resuming consumer. [ultMessageListenerContainer-55] +++JMS +++ INFO Received: 9900 messages so far. Last group took: 758 millis which is: 131.926 messages per second. average: 159.395 [currentConsumers=25&size=25000] ThrottlingInflightRoutePolicy WARN Throttling consumer: 25 > 20 inflight exchange by suspending consumer. [currentConsumers=25&size=25000] +++SEDA+++ INFO Received: 9900 messages so far. Last group took: 598 millis which is: 167.224 messages per second. average: 159.86 [currentConsumers=25&size=25000] ThrottlingInflightRoutePolicy WARN Throttling consumer: 2 <= 2 inflight exchange by resuming consumer. [currentConsumers=25&size=25000] ThrottlingInflightRoutePolicy WARN Throttling consumer: 24 > 20 inflight exchange by suspending consumer. [currentConsumers=25&size=25000] ThrottlingInflightRoutePolicy WARN Throttling consumer: 2 <= 2 inflight exchange by resuming consumer. [currentConsumers=25&size=25000] ThrottlingInflightRoutePolicy WARN Throttling consumer: 25 > 20 inflight exchange by suspending consumer. [currentConsumers=25&size=25000] ThrottlingInflightRoutePolicy WARN Throttling consumer: 2 <= 2 inflight exchange by resuming consumer. [ultMessageListenerContainer-76] +++JMS +++ INFO Received: 10000 messages so far. Last group took: 732 millis which is: 136.612 messages per second. average: 159.129 [currentConsumers=25&size=25000] +++SEDA+++ INFO Received: 10000 messages so far. Last group took: 732 millis which is: 136.612 messages per second. average: 159.589 However if you run the example without the throttling you will notice that the JMS consumer runs faster than we can process the messages. Towards the end we have more than 2000 messages pending on the internal SEDA queue, when the JMS consumer finishes. [ultMessageListenerContainer-41] +++JMS +++ INFO Received: 9800 messages so far. Last group took: 304 millis which is: 328.947 messages per second. average: 225.272 [currentConsumers=25&size=25000] +++SEDA+++ INFO Received: 7800 messages so far. Last group took: 645 millis which is: 155.039 messages per second. average: 178.461 [ultMessageListenerContainer-65] +++JMS +++ INFO Received: 9900 messages so far. Last group took: 543 millis which is: 184.162 messages per second. average: 224.765 [currentConsumers=25&size=25000] +++SEDA+++ INFO Received: 7900 messages so far. Last group took: 438 millis which is: 228.311 messages per second. average: 178.956 [ultMessageListenerContainer-65] +++JMS +++ INFO Received: 10000 messages so far. Last group took: 395 millis which is: 253.165 messages per second. average: 225.017 [currentConsumers=25&size=25000] +++SEDA+++ INFO Received: 8000 messages so far. Last group took: 408 millis which is: 245.098 messages per second. average: 179.561 [currentConsumers=25&size=25000] +++SEDA+++ INFO Received: 8100 messages so far. Last group took: 410 millis which is: 243.902 messages per second. average: 180.148 [currentConsumers=25&size=25000] +++SEDA+++ INFO Received: 8200 messages so far. Last group took: 405 millis which is: 246.914 messages per second. average: 180.744 [currentConsumers=25&size=25000] +++SEDA+++ INFO Received: 8300 messages so far. Last group took: 404 millis which is: 247.525 messages per second. average: 181.334 [currentConsumers=25&size=25000] +++SEDA+++ INFO Received: 8400 messages so far. Last group took: 404 millis which is: 247.525 messages per second. average: 181.913 [currentConsumers=25&size=25000] +++SEDA+++ INFO Received: 8500 messages so far. Last group took: 666 millis which is: 150.15 messages per second. average: 181.461 [currentConsumers=25&size=25000] +++SEDA+++ INFO Received: 8600 messages so far. Last group took: 405 millis which is: 246.914 messages per second. average: 182.022 [currentConsumers=25&size=25000] +++SEDA+++ INFO Received: 8700 messages so far. Last group took: 404 millis which is: 247.525 messages per second. average: 182.577 [currentConsumers=25&size=25000] +++SEDA+++ INFO Received: 8800 messages so far. Last group took: 407 millis which is: 245.7 messages per second. average: 183.112 [currentConsumers=25&size=25000] +++SEDA+++ INFO Received: 8900 messages so far. Last group took: 404 millis which is: 247.525 messages per second. average: 183.649 [currentConsumers=25&size=25000] +++SEDA+++ INFO Received: 9000 messages so far. Last group took: 404 millis which is: 247.525 messages per second. average: 184.177 [currentConsumers=25&size=25000] +++SEDA+++ INFO Received: 9100 messages so far. Last group took: 405 millis which is: 246.914 messages per second. average: 184.693 [currentConsumers=25&size=25000] +++SEDA+++ INFO Received: 9200 messages so far. Last group took: 405 millis which is: 246.914 messages per second. average: 185.2 [currentConsumers=25&size=25000] +++SEDA+++ INFO Received: 9300 messages so far. Last group took: 404 millis which is: 247.525 messages per second. average: 185.703 [currentConsumers=25&size=25000] +++SEDA+++ INFO Received: 9400 messages so far. Last group took: 405 millis which is: 246.914 messages per second. average: 186.194 [currentConsumers=25&size=25000] +++SEDA+++ INFO Received: 9500 messages so far. Last group took: 405 millis which is: 246.914 messages per second. average: 186.677 [currentConsumers=25&size=25000] +++SEDA+++ INFO Received: 9600 messages so far. Last group took: 408 millis which is: 245.098 messages per second. average: 187.142 [currentConsumers=25&size=25000] +++SEDA+++ INFO Received: 9700 messages so far. Last group took: 413 millis which is: 242.131 messages per second. average: 187.581 [currentConsumers=25&size=25000] +++SEDA+++ INFO Received: 9800 messages so far. Last group took: 410 millis which is: 243.902 messages per second. average: 188.024 [currentConsumers=25&size=25000] +++SEDA+++ INFO Received: 9900 messages so far. Last group took: 579 millis which is: 172.712 messages per second. average: 187.856 [currentConsumers=25&size=25000] +++SEDA+++ INFO Received: 10000 messages so far. Last group took: 404 millis which is: 247.525 messages per second. average: 188.31 So by using the See Also |