Debugger
Available as of Camel 2.6
Camel Debugger is much related to Tracer, in fact they are sisters. Debugger is a enhanced tracer with a debugger framework so that tooling can be developed to easily monitor Camel routes, trace messages and set breakpoints at points in a route etc.
There is also a BacklogDebugger which allows to debug from JMX, and 3rd party tooling.
About the Debugger
The Debugger allows tooling or the likes to attach breakpoints which is being invoked when Exchanges are being routed.
Default Implementation
Camel provides a default implementation org.apache.camel.impl.DefaultDebugger which you can set on the CamelContext using the setDebugger method. Likewise you can get hold of the Debugger using the getDebugger method on CamelContext.
The org.apache.camel.spi.Debugger has methods to attach and remove breakpoints. And to suspend/resume all breakpoints etc. You can also attach a condition to the breakpoint so it only reacts if the condition matches.
Debugging Camel Routes Using camel-test
If you are developing unit tests using the camel-test component, then the Debugger comes out of the box. From Camel 2.9: you would need to explicit enable the debugger, by overriding isUseDebugger() method and return true.
Example
In this unit test
public class DebugTest extends CamelTestSupport
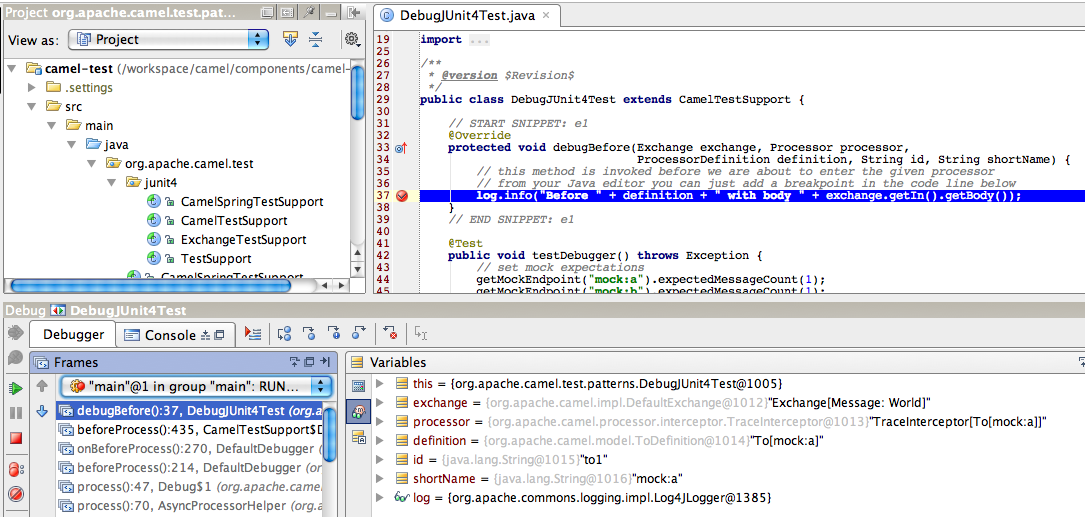
We want to debug the following route:{snippet:id=e2|lang=java|url=camel/trunk/components/camel-test/src/test/java/org/apache/camel/test/patterns/DebugTest.java}Which can easily done by overriding the debugBefore method as shown:{snippet:id=e1|lang=java|url=camel/trunk/components/camel-test/src/test/java/org/apache/camel/test/patterns/DebugTest.java}Then from your Java editor just add a breakpoint inside the debugBefore method. Then fire up the unit test and wait for the Java editor to hit the breakpoint. Then you can inspect the Exchange during debugging while it advances during routing. The ProcessorDefinition and the id and shortName parameters is all information which tells you where in the route the breakpoint was hit.
There is also a debugAfter method which is invoked after the processor has been invoked. This allows you to see what happens to the Exchange right after it has invoked a processor in the route.
The screenshot below shows the Debugger in action. The IDE (IDEA) has hit the breakpoint and we can inspect the parameters. Notice how we can see that the message is to be send to the mock:a endpoint:
See Also