
21. Hints and Tips
This section is a collection of various hints and tips that have been suggested by various questions on the JMeter User list. If you don't find what you are looking for here, please check the JMeter Wiki. Also, try search the JMeter User list; someone may well have already provided a solution.
21.1 Passing variables between threads
JMeter variables have thread scope. This is deliberate, so that threads can act indepently. However sometimes there is a need to pass variables between different threads, in the same or different Thread Groups.
One way to do this is to use a property instead. Properties are shared between all JMeter threads, so if one thread sets a property, another thread can read the updated value.
If there is a lot of information that needs to be passed between threads, then consider using a file. For example you could use the Save Responses to a file listener or perhaps a BeanShell PostProcessor in one thread, and read the file using the HTTP Sampler "file:" protocol, and extract the information using a PostProcessor or BeanShell element.
If you can derive the data before starting the test, then it may well be better to store it in a file, read it using CSV Dataset.
21.2 Enabling Debug logging
Most test elements include debug logging. If running a test plan from the GUI, select the test element and use the Help Menu to enable or disable logging. The Help Menu also has an option to display the GUI and test element class names. You can use these to determine the correct property setting to change the logging level.
It is sometimes very useful to see Log messages to debug dynamic scripting languages like BeanShell or groovy used in JMeter. Since version 2.6, you can view log messages directly in JMeter GUI, to do so:
- use menu Options > Log Viewer, a log console will appear at the bottom of the interface
- Or click on the Warning icon in the upper right corner of GUI
- jmeter.loggerpanel.display=true
- jmeter.loggerpanel.maxlength=80000
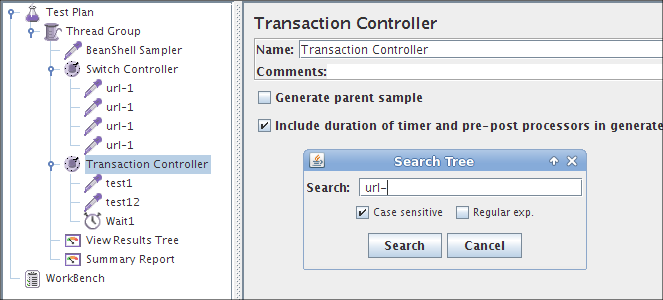
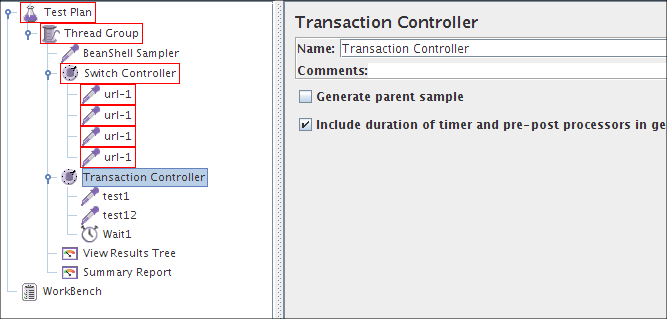
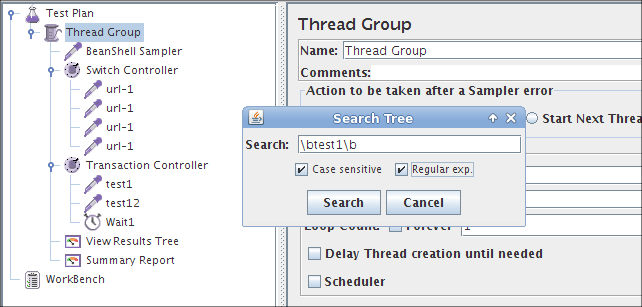
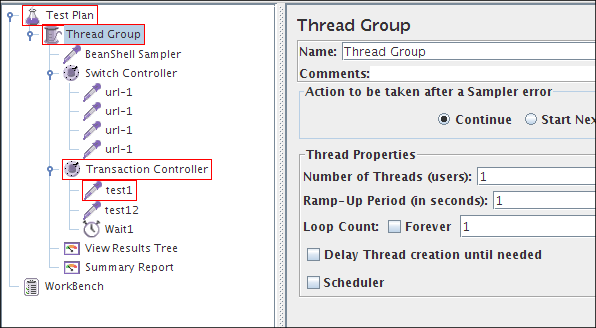
21.3 Searching
It is sometimes hard to find in a Test Plan tree and elements using a variable or containing a certain URL or parameter. A new feature is now available since 2.6, you can access it in Menu Search. It provides search with following options:
- Case Sensitive : Makes search case sensitive
- Regexp : Is text to search a regexp, if so Regexp will be searched in Tree of components, example "\btest\b" will match any component that contains test in searchable elements of the component
21.4 Toolbar icons size
You can change the size of icons in the toolbar using the property
jmeter.toolbar.icons.sizewith these values: 22x22 (default size), 32x32 or 48x48.