
Changes
Earlier changes are detailed in the History of Previous Changes.
Version 2.13
Summary- New and Noteworthy
- Known bugs
- Incompatible changes
- Bug fixes
- Improvements
- Non-functional changes
- Thanks
New and Noteworthy
New Elements
New Async BackendListener with Graphite implementation
A new Async BackendListener has been added to allow sending result data to a backend listener. JMeter ships with a GraphiteBackendListenerClient that allows sending results to a Graphite server using Pickle ot Plaintext protocols. You can implement your own backend by extending AbstractBackendListenerClient. This backend could be a database (JDBC), a Message Oriented Middleware (JMS), a Webservice or anything you want.
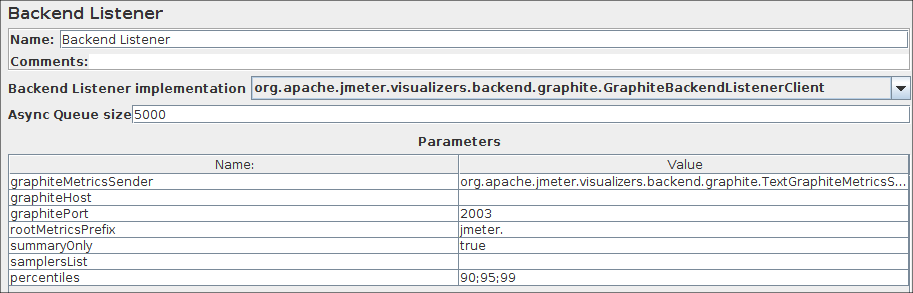
This is the kind of Live Dashboard you can obtain using Grafana and InfluxDB
Read this for more details.

Core Improvements
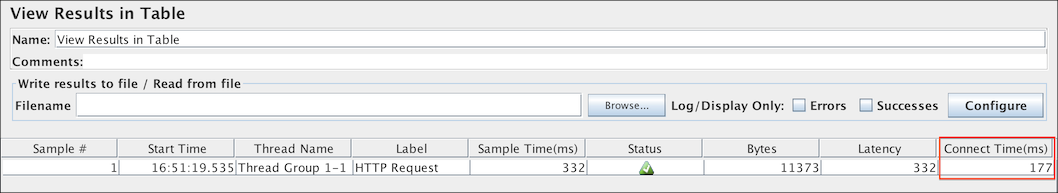
New connect time metric
Starting with this version a new metric called connectTime has been added. It represents the time to establish connection.
By default it is not saved to CSV or XML, to have it saved add to user.properties:
jmeter.save.saveservice.connect_time=true

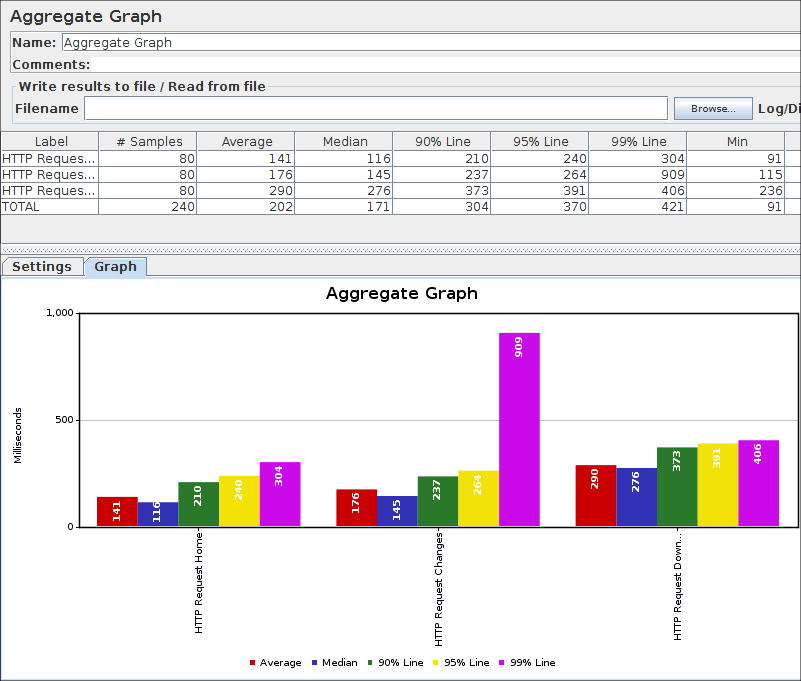
Aggregate Graph and Report
The listeners Aggregate Graph and Aggregate Report previously showed only the 90 percentile (historical behavior), the 95 percentile and the 99 percentile have been added and are customizable.
To setup the percentiles value you want, add to user.properties:
aggregate_rpt_pct1=90
aggregate_rpt_pct2=95
aggregate_rpt_pct3=99
HTTP(S) Test Script Recorder
Now component is able to detect authentication schemes and automatically adds a pre-configured HTTP Authorization Manager with the correct Mechanism.
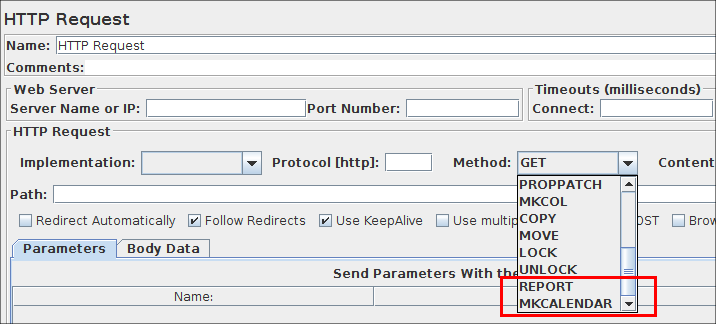
HTTP Request
The CalDAV verbs (Calendar extensions to WebDAV) REPORT and MKCALENDAR have been added in the HTTP Request sampler.
JDBC Request
The ResultSet can be get as a object, this allows to handle more easily the results after in BeanShell, JSR223 scripts...

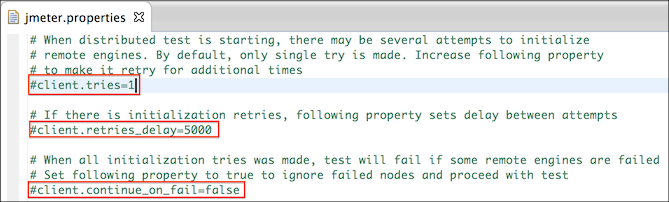
Distributed Testing
To allow better usage of Distributed Testing in the cloud, retry behaviour has been added when starting test on servers.
Read this for more details.
Distributed Testing performance
Since JMeter 2.13, Stripping modes (StrippingBatch being the default mode) now also strip responses from SubResults improving consumed network bandwidth.
Documentation refresh
A new style for website (responsive and more up to date) has been created by Felix Schumacher. Documentations have been refreshed particularly:
GUI Improvements
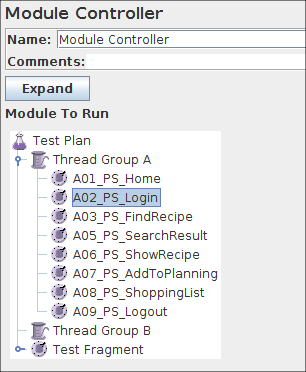
Module Controller
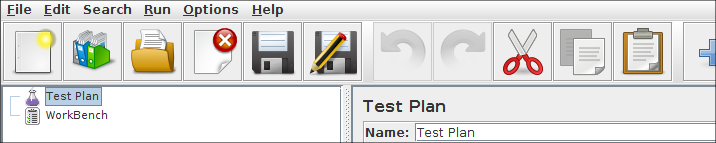
The Module Controller now shows the target controller in a tree view (instead of combo list).
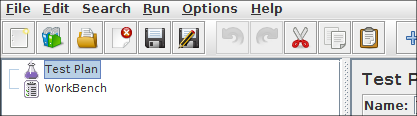
Toolbar
JMeter's toolbar has been refreshed for some icons (start, toogle, etc.). Three sizes are now avialable for the icons: 22x22, 32x32 and 48x48.
The property to define your prefered size is:
jmeter.toolbar.icons.size=valuewith the value 22x22 (default size), 32x32 or 48x48.
The toolbar with 22x22 pixels icons
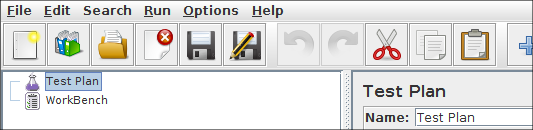
The toolbar with 32x32 pixels icons
The toolbar with 48x48 pixels icons
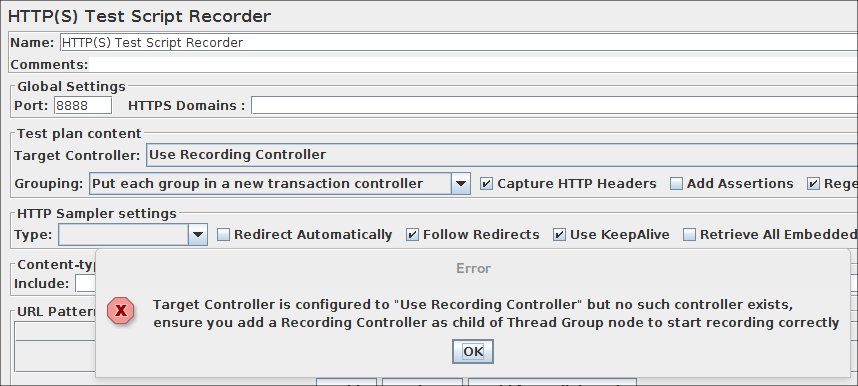
HTTP(S) Test Script Recorder
If your Test Plan does not contains a Recording Controller, a new warning message will appear if the
HTTP(S) Test Script Recorder is configured to send the samples into a Recording Controller.
Incompatible changes
- Since 2.13, Aggregate Graph, Summary Report and Aggregate Report now export percentages to %, before they exported the decimal value which differed from what was shown in GUI
- Third party plugins may be impacted by fix of Bug 57586, ensure that your subclass of HttpTestSampleGui implements ItemListener if you relied on parent class doing so.
- Report package has been removed, ApacheJMeter_report.jar is not generated anymore as a consequence, see Bug 57269
Improvements
HTTP Samplers and Test Script Recorder
- Bug 25430 - HTTP(S) Test Script Recorder : Make it populate HTTP Authorization Manager. Partly based on a patch from Dzmitry Kashlach (dzmitrykashlach at gmail.com)
- Bug 57381 - HTTP(S) Test Script Recorder should display an error if Target Controller references a Recording Controller and no Recording Controller exists. Contributed by Ubik Load Pack (support at ubikloadpack.com)
- Bug 57488 - Performance : Improve SSLContext reset for Two-way SSL Authentication
- Bug 57565 - SamplerCreator : Add method to allow implementations to add children to created sampler
- Bug 57606 - HTTPSamplerBase#errorResult changes the sample label on exception
- Bug 57613 - HTTP Sampler : Added CalDAV verbs (REPORT, MKCALENDAR). Contributed by Richard Brigham (richard.brigham at teamaol.com)
- Bug 48799 - Add time to establish connection to available sample metrics. Implemented by Andrey Pokhilko (andrey at blazemeter.com) and contributed by BlazeMeter Ltd. and Pieter Ennes (apache.org at spam.ennes.nl)
- Bug 57500 - Introduce retry behavior for distributed testing. Implemented by Andrey Pokhilko and Dzimitry Kashlach and contributed by BlazeMeter Ltd.
Other samplers
- Bug 57322 - JDBC Test elements: add ResultHandler to deal with ResultSets(cursors) returned by callable statements. Contributed by Yngvi Þór Sigurjónsson (blitzkopf at gmail.com)
Controllers
- Bug 57561 - Module controller UI : Replace combobox by tree. Contributed by Maciej Franek (maciej.franek at gmail.com)
- Bug 57648 - TestFragment should be disabled when created. Contributed by Ubik Load Pack (support at ubikloadpack.com)
Listeners
- Bug 55932 - Create a Async BackendListener to allow easy plug of new listener (Graphite, JDBC, Console,...)
- Bug 57246 - BackendListener : Create a Graphite implementation
- Bug 57217 - Aggregate graph and Aggregate report improvements (3 configurable percentiles, same data in both, factor out code). Contributed by Ubik Load Pack (support at ubikloadpack.com)
- Bug 57537 - BackendListener : Allow implementations to drop samples
Timers, Assertions, Config, Pre- & Post-Processors
Functions
- Bug 54453 - Performance enhancements : Replace Random by ThreadLocalRandom in __Random function
I18N
General
- Bug 57518 - Icons for toolbar with several sizes
- Bug 57605 - When there is an error loading Test Plan, SaveService.loadTree returns null leading to NPE in callers
- Bug 57269 - Drop org.apache.jmeter.reports package
- Bug 53764 - Website : Create a new style for website
Non-functional changes
- Updated to jsoup-1.8.1.jar (from 1.7.3)
- Updated to tika-core and tika-parsers 1.7 (from 1.6)
- Updated to commons-codec-1.10.jar (from 1.9)
- Updated to dnsjava-2.1.7.jar (from 2.1.6)
- Updated to jodd-3.6.4.jar (from 3.6.1)
- Updated to junit-4.12.jar (from 4.11)
- Updated to rhino-1.7R5 (from 1.7R4)
- Updated to rsyntaxtextarea-2.5.6 (from 2.5.3)
- Updated to slf4j-1.7.10 (from 1.7.5)
- Bug 57276 - RMIC no longer needed since Java 5
- Bug 57310 - Replace System.getProperty("file.separator") with File.separator throughout (Also "path.separator" with File.pathSeparator)
- Bug 57389 - Fix potential NPE in converters
- Bug 57417 - Remove unused method isTemporary from NullProperty. This was a leftover from a refactoring done in 2003.
- Bug 57418 - Remove unused constructor from Workbench
- Bug 57419 - Remove unused interface ModelListener.
- Bug 57466 - IncludeController : Remove an unneeded set creation. Contributed by Benoit Wiart (benoit.wiart at gmail.com)
- Added property loggerpanel.usejsyntaxtext to disable the use of JSyntaxTextArea for the Console Logger (in case of memory or other issues)
- Bug 57586 - HttpTestSampleGui: Remove interface ItemListener implementation
Bug fixes
HTTP Samplers and Test Script Recorder
- Bug 57385 - Getting empty thread name in xml result for HTTP requests with "Follow Redirects" set. Contributed by Ubik Load Pack (support at ubikloadpack.com)
- Bug 57579 - NullPointerException error is raised on main sample if "RETURN_NO_SAMPLE" is used (default) and "Use Cache-Control / Expires header..." is checked in HTTP Cache Manager
Other Samplers
Controllers
- Bug 57447 - Use only the user listed DNS Servers, when "use custom DNS resolver" option is enabled.
Listeners
- Bug 57262 - Aggregate Report, Aggregate Graph and Summary Report export : headers use keys instead of labels
- Bug 57346 - Summariser : The + (difference) reports show wrong elapsed time and throughput
- Bug 57449 - Distributed Testing: Stripped modes do not strip responses from SubResults (affects load tests that use Download of embedded resources). Contributed by Ubik Load Pack (support at ubikloadpack.com)
- Bug 57562 - View Results Tree CSS/JQuery Tester : Nothing happens when there is an error in syntax and an exception occurs in jmeter.log
- Bug 57514 - Aggregate Graph, Summary Report and Aggregate Report show wrong percentage reporting in saved file
Timers, Assertions, Config, Pre- & Post-Processors
- Bug 57607 - Constant Throughput Timer : Wrong throughput computed in shared modes due to rounding error
General
- Bug 57365 - Selected LAF is not correctly setup due to call of UIManager.setLookAndFeel too late. Contributed by Ubik Load Pack (support at ubikloadpack.com)
- Bug 57364 - Options < Look And Feel does not update all windows LAF. Contributed by Ubik Load Pack (support at ubikloadpack.com)
- Bug 57394 - When constructing an instance with ClassTools#construct(String, int) the integer was ignored and the default constructor was used instead.
- Bug 57440 - OutOfMemoryError after introduction of JSyntaxTextArea in LoggerPanel due to disableUndo not being taken into account.
- Bug 57569 - FileServer.reserveFile - inconsistent behaviour when hasHeader is true
- Bug 57555 - Cannot use JMeter 2.12 as a maven dependency. Contributed by Pascal Schumacher (pascal.schumacher at t-systems.com)
- Bug 57608 - Fix start script compatibility with old Unix shells, e.g. on Solaris
Thanks
We thank all contributors mentioned in bug and improvement sections above:
- Ubik Load Pack
- Yngvi Þór Sigurjónsson (blitzkopf at gmail.com)
- Dzmitry Kashlach (dzmitrykashlach at gmail.com)
- BlazeMeter Ltd.
- Benoit Wiart (benoit.wiart at gmail.com)
- Pascal Schumacher (pascal.schumacher at t-systems.com)
- Maciej Franek (maciej.franek at gmail.com)
- Richard Brigham (richard.brigham at teamaol.com)
- Pieter Ennes (apache.org at spam.ennes.nl)
We also thank bug reporters who helped us improve JMeter.
For this release we want to give special thanks to the following reporters for the clear reports and tests made after our fixes:
- Chaitanya Bhatt (bhatt.chaitanya at gmail.com) for his thorough testing of new BackendListener and Graphite Client implementation.
- Marcelo Jara (marcelojara at hotmail.com) for his clear report on Bug 57607.
Known bugs
- The Once Only controller behaves correctly under a Thread Group or Loop Controller, but otherwise its behaviour is not consistent (or clearly specified).
- The numbers that appear to the left of the green box are the number of active threads / total number of threads, the total number of threads only applies to a locally run test, otherwise it will show 0 (see Bug 55510).
-
Note that there is a bug in Java
on some Linux systems that manifests itself as the following error when running the test cases or JMeter itself:
 [java] WARNING: Couldn't flush user prefs:
 java.util.prefs.BackingStoreException:
 java.lang.IllegalArgumentException: Not supported: indent-number
This does not affect JMeter operation. This issue is fixed since Java 7b05. -
Note that under some windows systems you may have this WARNING:
java.util.prefs.WindowsPreferences
WARNING: Could not open/create prefs root node Software\JavaSoft\Prefs at root 0
x80000002. Windows RegCreateKeyEx(...) returned error code 5.
The fix is to run JMeter as Administrator, it will create the registry key for you, then you can restart JMeter as a normal user and you won't have the warning anymore. - With Java 1.6 and Gnome 3 on Linux systems, the JMeter menu may not work correctly (shift between mouse's click and the menu). This is a known Java bug (see Bug 54477). A workaround is to use a Java 7 runtime (OpenJDK or Oracle JDK).
- With Oracle Java 7 and Mac Book Pro Retina Display, the JMeter GUI may look blurry. This is a known Java bug, see Bug JDK-8000629. A workaround is to use a Java 7 update 40 runtime which fixes this issue.
-
You may encounter the following error: java.security.cert.CertificateException: Certificates does not conform to algorithm constraints
if you run a HTTPS request on a web site with a SSL certificate (itself or one of SSL certificates in its chain of trust) with a signature
algorithm using MD2 (like md2WithRSAEncryption) or with a SSL certificate with a size lower than 1024 bits.
This error is related to increased security in Java 7 version u16 (MD2) and version u40 (Certificate size lower than 1024 bits), and Java 8 too.
To allow you to perform your HTTPS request, you can downgrade the security of your Java installation by editing the Java jdk.certpath.disabledAlgorithms property. Remove the MD2 value or the constraint on size, depending on your case.
This property is in this file:JAVA_HOME/jre/lib/security/java.security
See Bug 56357 for details.