
15. Real-time results
Since JMeter 2.13 you can get real-time results sent to a backend through the
Backend Listener using potentially any backend (JDBC, JMS, Webservice, …)
by providing a class which implements AbstractBackendListenerClient.
JMeter ships with:
- a GraphiteBackendListenerClient which allows you to send metrics to a Graphite Backend.
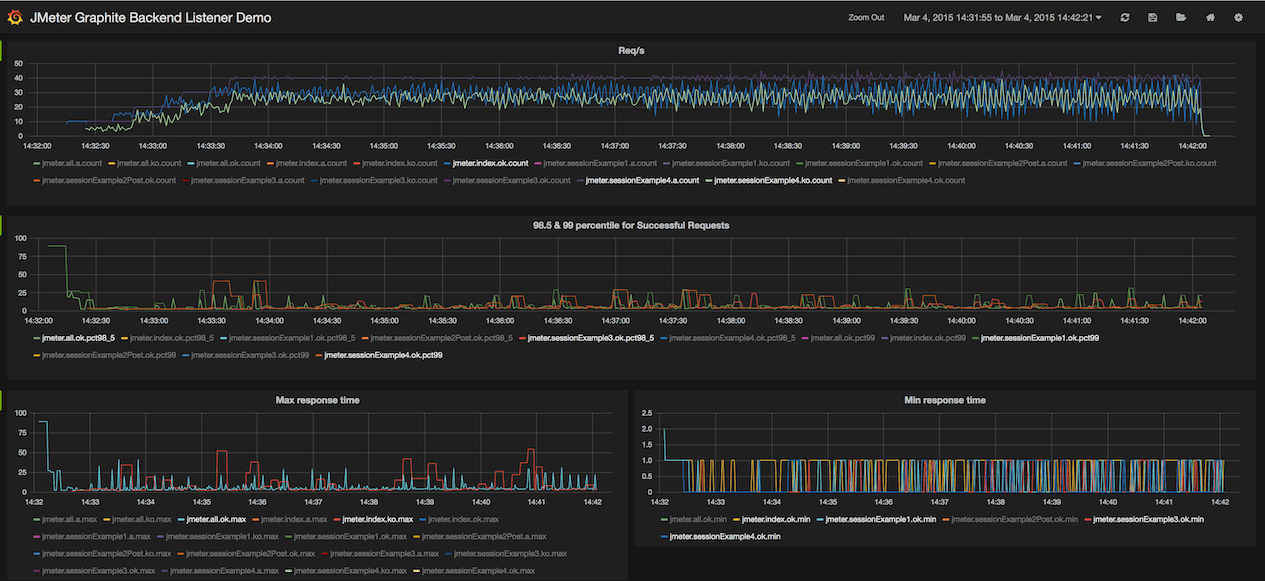
This feature provides:- Live results
- Nice graphs for metrics
- Ability to compare 2 or more load tests
- Storing monitoring data as long as JMeter results in the same backend
- …
- an InfluxDBBackendListenerClient introduced in JMeter 3.2 which allows you to send metrics to an InfluxDB Backend using UDP or HTTP protocols
This feature provides:
- Live results
- Nice graphs for metrics
- Ability to compare 2 or more load tests
- Ability to add annotations to graphs
- Storing monitoring data as long as JMeter results in the same backend
- …
- InfluxDB setup for InfluxDBBackendListenerClient
- InfluxDB setup for GraphiteBackendListenerClient
- Grafana
- Graphite
15.1 Metrics exposed
15.1.1 Thread/Virtual Users metrics
Thread metrics are the following:
- <rootMetricsPrefix>test.minAT
- Min active threads
- <rootMetricsPrefix>test.maxAT
- Max active threads
- <rootMetricsPrefix>test.meanAT
- Mean active threads
- <rootMetricsPrefix>test.startedT
- Started threads
- <rootMetricsPrefix>test.endedT
- Finished threads
15.1.2 Response times metrics
Response related metrics are the following:
- <rootMetricsPrefix><samplerName>.ok.count
- Number of successful responses for sampler name
- <rootMetricsPrefix><samplerName>.h.count
- Server hits per seconds, this metric cumulates Sample Result and Sub results (if using Transaction Controller, "Generate parent sampler" should be unchecked)
- <rootMetricsPrefix><samplerName>.ok.min
- Min response time for successful responses of sampler name
- <rootMetricsPrefix><samplerName>.ok.max
- Max response time for successful responses of sampler name
- <rootMetricsPrefix><samplerName>.ok.avg
- Average response time for successful responses of sampler name.
- <rootMetricsPrefix><samplerName>.ok.pct<percentileValue>
- Percentile computed for successful responses of sampler name. There will be one metric for each calculated value.
- <rootMetricsPrefix><samplerName>.ko.count
- Number of failed responses for sampler name
- <rootMetricsPrefix><samplerName>.ko.min
- Min response time for failed responses of sampler name
- <rootMetricsPrefix><samplerName>.ko.max
- Max response time for failed responses of sampler name
- <rootMetricsPrefix><samplerName>.ko.avg
- Average response time for failed responses of sampler name.
- <rootMetricsPrefix><samplerName>.ko.pct<percentileValue>
- Percentile computed for failed responses of sampler name. There will be one metric for each calculated value.
- <rootMetricsPrefix><samplerName>.a.count
- Number of responses for sampler name (sum of ok.count and ko.count)
- <rootMetricsPrefix><samplerName>.sb.bytes
- Sent Bytes
- <rootMetricsPrefix><samplerName>.rb.bytes
- Received Bytes
- <rootMetricsPrefix><samplerName>.a.min
- Min response time for responses of sampler name (min of ok.count and ko.count)
- <rootMetricsPrefix><samplerName>.a.max
- Max response time for responses of sampler name (max of ok.count and ko.count)
- <rootMetricsPrefix><samplerName>.a.avg
- Average response time for responses of sampler name (avg of ok.count and ko.count)
- <rootMetricsPrefix><samplerName>.a.pct<percentileValue>
- Percentile computed for responses of sampler name. There will be one metric for each calculated value. (calculated on the totals for OK and failed samples)
The default percentiles setting on the Backend Listener is "90;95;99", i.e. the 3 percentiles 90%, 95% and 99%.
The Graphite naming hierarchy uses dot (".") to separate elements. This could be confused with decimal percentile values. JMeter converts any such values, replacing dot (".") with underscore ("-"). For example, "99.9" becomes "99_9"
By default JMeter sends metrics for all samplers accumulated under the samplerName "all". If the Backend Listener samplersList is configured, then JMeter also sends the metrics for the matching sample names unless summaryOnly=true
15.2 JMeter configuration
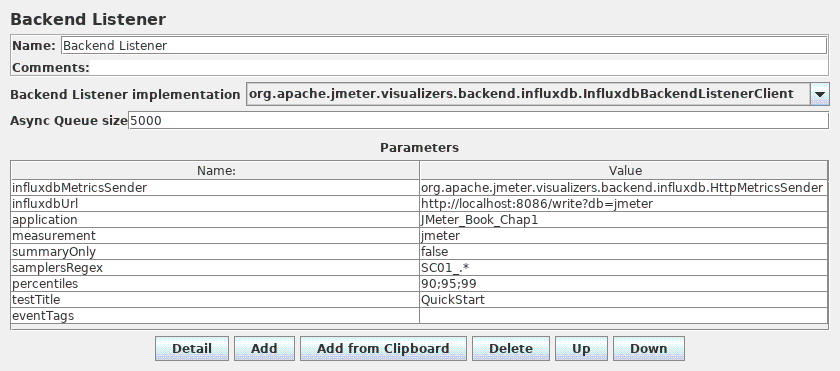
To make JMeter send metrics to backend add a BackendListener using the InfluxDBBackendListenerClient.
15.3 InfluxDB database configuration
Connect to InfluxDB using InfluxDB’s Command Line Interface (CLI). and create JMeter database:
- jmeter : Used by InfluxDB to store the data sent by the Backend Listener
15.3.1 InfluxDB setup for InfluxDBBackendListenerClient
InfluxDB is an open-source, distributed, time-series database that allows to
easily store metrics.
Installation and configuration is very easy, read this for more details InfluxDB documentation.
InfluxDB data can be easily viewed in a browser through Grafana.
15.4 Grafana configuration
Installing grafana
Read documentation for more details.
Add the datasource
15.5 Graphite
HELP WELCOME for this section, see Contributing documentation