
Dashboard generator
This document describes the architecture and operation of the dashboard generation engine.
1 Overview
1.1 Architecture
The dashboard generation engine is a modular feature based on
samples operation processes.
The processes can be represented by the following diagram:
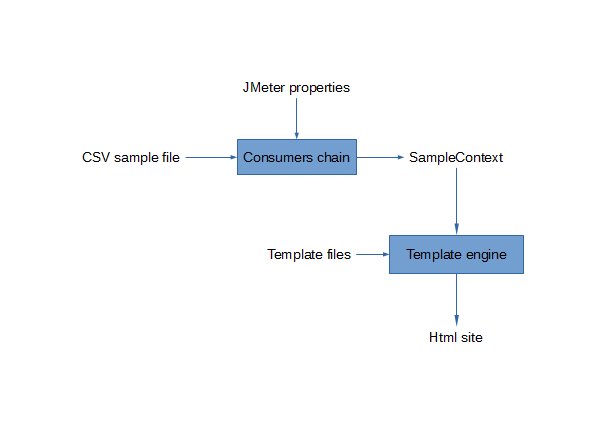
In this view, you can see:
- A source from where samples are produced (e.g. CSV file).
- A chain of items, named consumers, that operate on the samples that go through the chain (e.g. Filtering, sorting, calculation, …).
- An execution context, named sample context, where the results of consumers calculations are stored.
- A set of items, named exporters, that use the content of the sample context to generate a final result to the user (e.g. HTML page generation).
1.2 Operation
Before producing samples, the source is associated with a sample context that will be used to store the consumers results.
Then a chain of consumers is built using JMeter properties (prefixed by jmeter.reportgenerator ) in order to enable the user to customize it.
When the source emits a sample, it sends it to the first consumer
of the chain.
The consumer can have different behaviors:
- It can process the sample and send it to the next consumers.
- It cannot process the sample, so it stores it and continues to receive other samples. When it can process the stored samples, it does so and sends the whole to the next consumers (e.g. sorting).
- It can choose to discard the sample (e.g. filtering).
The latter is send to the set of exporters in order to create results used by final user.
2 Consumers chain details
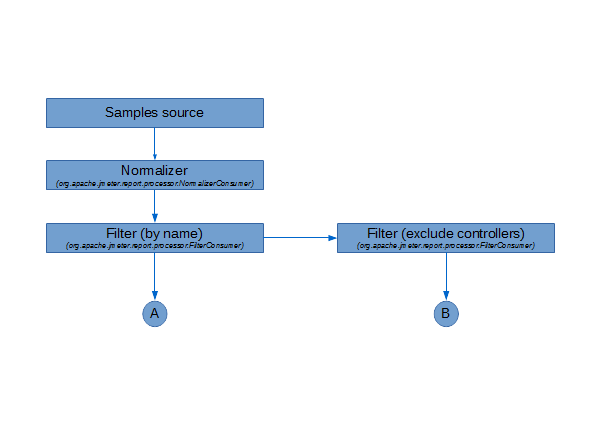
The chain begins with a normalizer consumer in charge of standardizing the timestamp of each sample because JMeter allows different timestamp formats (See jmeter.save.saveservice.timestamp_format ).
Then two consumers have to define the start time and end time of the load tests.
At the same level a filter consumer keeps or discards samples depending on the jmeter.reportgenerator.sample_filter property.
Another filter is plugged after to discard controller samples.
Depending on the property jmeter.reportgenerator.graph.<graph_id>.exclude_controllers , the graph consumer matching the graph_id identifier will be set at position A or B .
3 Template processing
3.1 Overview
The default exporter of the generator use the template engine
freemarker
to produce html pages.
Template files are located in the template
directory defined by
the JMeter property
"jmeter.reportgenerator.template_dir"
and have
the extension ".fmkr".
The graph references in the template files use the syntax : ${<graph_id>.<value>} where :
- graph_id
- is the identifier of the graph matching the JMeter properties definition
- value
- is the name of the value where data are stored.
Each graph produces the following values :
- maxX:
- The maximum abscissa of the graph (double).
- maxY:
- The maximum ordinate of the graph (double).
- minX:
- The minimum abscissa of the graph (double).
- minY:
- The maximum ordinate of the graph (double).
- title:
- The title of the graph (string).
- values:
- A JSON object representing the data of the graph series (string).
3.2 Customization
You can customize the dashboard generation by modifying the files in the template directory.
If you want to add a graph to the dashboard, you have to declare it among the JMeter properties and use its references in the template files.
If you want to remove a graph from the dashboard, you must remove all its references in the template files and clear JMeter properties.
4 Limitations and Outlooks
-
Till now, there is only one sample source implementation which is strongly coupled with the CSV file format, we should allow other kinds of source by using a sample source interface.
-
To add customized graph, users must extend the AbstractGraphConsumer or use one of the implementations provided in the package org.apache.jmeter.report.processor.graph.impl . This could be enhanced by making concrete the base class and give public access to additional properties (like selectors). But first we have to resolve the issue of shared properties (e.g. over time graphs must dispatch the same granularity property to the keys selector and time rate aggregator).
-
The chain building is dispatched between the org.apache.jmeter.report.dashboard.ReportGenerator.generate method and the implementation of the consumers. So the code in charge of the building is split and furthermore some consumers can be redundant and harm the performance of report generation, not load testing.
E.g. Each LatencyVSRequestGraphConsumer and ResponseTimeVSRequestGraphConsumer instances use an embedded consumer that could be shared depending on granularity and exclude_controllers properties.
So we should enable the consumers to define the chain they require and provide a single chain builder that processes these chain requirements to instantiate needed consumers on demand. I.e. for the same chain requirement declaration, the same consumer instances are used. Otherwise if the declaration differs, a new branch of consumers is created.
-
The graphs (DOM elements) in the generated HTML page should be dynamically build in order to match the graphs defined in JMeter properties.
-
Some improvements can be done on the generated html pages:
- Using a single page, and hide graphs depending on the navigation menu selection.
- Adding a loading animation when graphs are build or refreshed.
- Let the user determine if a graph is zoomable using a JMeter property.
- Using the jquery.plot.setData() method to handle series activation/deactivation rather than rebuild the graph.