
17. Real-time results
Since JMeter 2.13 you can get realtime results sent to a backend through the
Backend Listener using potentially any backend (JDBC, JMS, Webservice...) implementing AbstractBackendListenerClient.
JMeter ships with a GraphiteBackendListenerClient which allows you to send metrics to a Graphite Backend.
This feature provides:
- Live results
- Nice graphs for metrics
- Ability to compare 2 or more load tests
- Storing monitoring data as long as JMeter results in the same backend
- ...
- InfluxDB
- Graphite
17.1 Metrics exposed
17.1.1 Thread/Virtual Users metrics
Threads metrics are the following:
| Metric Name | Description |
|---|---|
| <rootMetricsPrefix>.test.minAT | Min active threads |
| <rootMetricsPrefix>.test.maxAT | Max active threads |
| <rootMetricsPrefix>.test.meanAT | Mean active threads |
| <rootMetricsPrefix>.test.startedT | Started threads |
| <rootMetricsPrefix>.test.endedT | Finished threads |
17.1.2 Response times metrics
Response times metrics are the following:
| Metric Name | Description |
|---|---|
| <rootMetricsPrefix>.<samplerName>.ok.count | Number of successful responses for sampler name |
| <rootMetricsPrefix>.<samplerName>.ok.min | Min response time for successful responses of sampler name |
| <rootMetricsPrefix>.<samplerName>.ok.max | Max response time for successful responses of sampler name |
| <rootMetricsPrefix>.<samplerName>.ok.pct<percentileValue> | Percentile computed for successful responses of sampler name. You can input as many percentiles as you want (3 or 4 being a reasonable value). When percentile contains a comma for example "99.9", dot is sanitized by "_" leading to 99_9. By default listener computes percentiles 90%, 95% and 99% |
| <rootMetricsPrefix>.<samplerName>.ko.count | Number of failed responses for sampler name |
| <rootMetricsPrefix>.<samplerName>.ko.min | Min response time for failed responses of sampler name |
| <rootMetricsPrefix>.<samplerName>.ko.max | Max response time for failed responses of sampler name |
| <rootMetricsPrefix>.<samplerName>.ko.pct<percentileValue> | Percentile computed for failed responses of sampler name. You can input as many percentiles as you want (3 or 4 being a reasonable value). When percentile contains a comma for example "99.9", dot is sanitized by "_" leading to 99_9. By default listener computes percentiles 90%, 95% and 99% |
| <rootMetricsPrefix>.<samplerName>.a.count | Number of responses for sampler name |
| <rootMetricsPrefix>.<samplerName>.a.min | Min response time for responses of sampler name |
| <rootMetricsPrefix>.<samplerName>.a.max | Max response time for responses of sampler name |
| <rootMetricsPrefix>.<samplerName>.a.pct<percentileValue> | Percentile computed for responses of sampler name. You can input as many percentiles as you want (3 or 4 being a reasonable value). When percentile contains a comma for example "99.9", dot is sanitized by "_" leading to 99_9. By default listener computes percentiles 90%, 95% and 99% |
By default JMeter sends only metrics for all samplers using "all" as samplerName.
17.2 JMeter configuration
To make JMeter send metrics to backend add a BackendListener using the GraphiteBackendListenerClient.

17.2 InfluxDB
InfluxDB is an open-source, distributed,time-series database that allows to
easily store metrics.
Installation and configuration is very easy, read this for more details InfluxDB documentation.
InfluxDB data can be easily viewed in a browser through either Influga or Grafana.
We will use Grafana in this case.
17.2.1 InfluxDB graphite listener configuration
To enable Graphite listener in InfluxDB, edit files /opt/influxdb/shared/config.toml or /usr/local/etc/influxdb.conf, find "input_plugins.graphite" and set this:
# Configure the graphite api[input_plugins.graphite]
enabled = true
address = "0.0.0.0" # If not set, is actually set to bind-address.
port = 2003
database = "jmeter" # store graphite data in this database
# udp_enabled = true # enable udp interface on the same port as the tcp interface
17.2.2 InfluxDB database configuration
Connect to InfluxDB admin console and create 2 databases:
- grafana : Used by Grafana to store the dashboards we will create
- jmeter : Used by InfluxDB to store the data sent to Graphite Listener as per database="jmeter" config element in influxdb.conf or config.toml
17.2.3 Grafana configuration
Installing grafana is just a matter of putting the unzipped bundle behind an Apache HTTP server.
Read documentation for more details.
Open config.js file and find datasources element, and edit it like this:
influxdb: {
type: 'influxdb',
url: "http://localhost:8086/db/jmeter",
username: 'root',
password: 'root',
}, grafana: {
type: 'influxdb',
url: "http://localhost:8086/db/grafana",
username: 'root',
password: 'root',
grafanaDB: true
},
},
Note that grafana has "grafanaDB:true". Also note that here we use root user for simplicity, it is better to dedicate a special user with less rights.
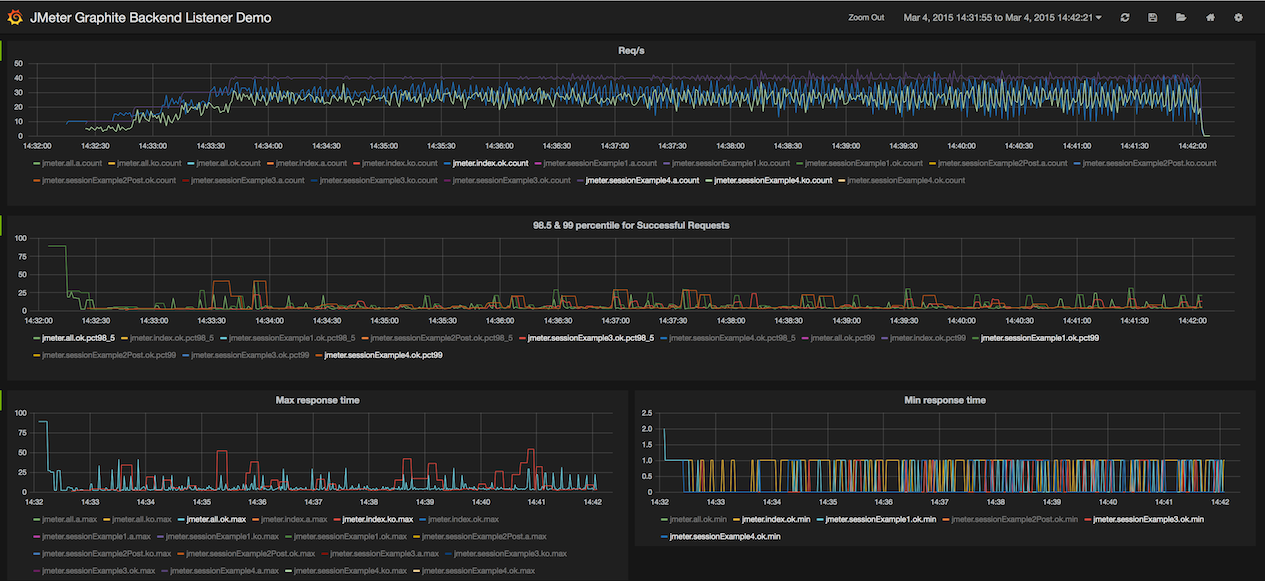
Here is the kind of dashboard that you could obtain:
17.3 Graphite
TODO.