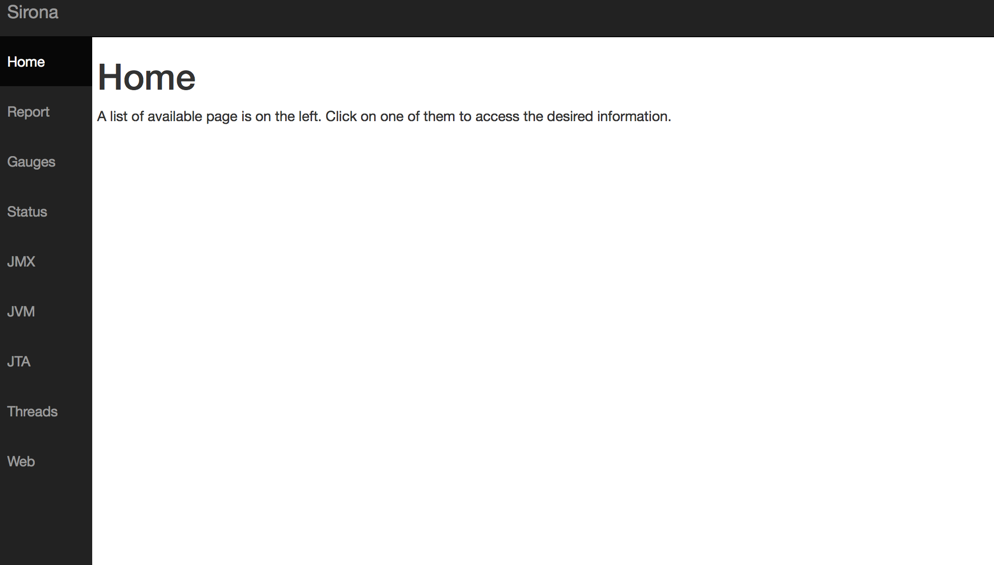
Installation
The webapp
sirona-reporting is available as a webapp (.war) so you can just drop it in your servlet container.
Note 1: sirona-core is not provided and should be in the container. Note 2: if you use sirona-jdbc put it in the container too.
Embeded in your web application
Just adding sirona-reporting jar (classifier classes if you use maven) in your application you can embed it. You’ll need to update your web.xml to declare the monitoring filter:
<web-app xmlns="http://java.sun.com/xml/ns/javaee"
         xmlns:xsi="http://www.w3.org/2001/XMLSchema-instance"
         xsi:schemaLocation="http://java.sun.com/xml/ns/javaee http://java.sun.com/xml/ns/javaee/web-app_2_5.xsd"
         version="2.5">

  <filter>
    <filter-name>Sirona</filter-name>
    <filter-class>org.apache.sirona.reporting.web.SironaController</filter-class>
    <init-param> <!-- should match your filter mapping base -->
      <param-name>monitoring-mapping</param-name>
      <param-value>/sirona/</param-value>
    </init-param>
  </filter>

  <filter-mapping>
    <filter-name>Sirona</filter-name>
    <url-pattern>/sirona/*</url-pattern>
  </filter-mapping>

</web-app>
Note: in a servlet 3.0 container you can just configure it through init parameters:
- org.apache.sirona.reporting.activated: boolean activating/deactivating the reporting GUI
- org.apache.sirona.reporting.mapping: the url mapping of the GUI